Introduction for Prometheus with Grafana
Prometheus with Grafana is an Open Source metric and alerting system. To monitor the Linux servers additionally, we need to install node exporter to get the way to look into each resource usage of Linux servers, It will show a brief in-depth by creating a cool different type of graphs.
The packages can be acquired from the default CentOS AppStream. However, to get the latest packages we need to create the repo for both.
Installation Method
Instead of installing from source, Let’s follow the safest way of installation from a yum repository. We get Prometheus package from below RPM repository.
https://packagecloud.io/prometheus-rpm/releaseSetup Prometheus Repository
Create the repository file.
# vim /etc/yum.repos.d/prometheus.repo
And append with the repo information.
[prometheus]
name=prometheus
baseurl=https://packagecloud.io/prometheus-rpm/release/el/$releasever/$basearch
repo_gpgcheck=1
enabled=1
gpgkey=https://packagecloud.io/prometheus-rpm/release/gpgkey
       https://raw.githubusercontent.com/lest/prometheus-rpm/master/RPM-GPG-KEY-prometheus-rpm
gpgcheck=1
metadata_expire=300
Installing Prometheus
If we have CentOS 6, 7 or 8 this repository will get the required packages for up and run the Prometheus with Grafana.
# yum makecache
# yum search prometheus -y
# yum install prometheus2 -y
Locally cache the repo and install the package.
Running transaction
  Preparing        :							            1/1
  Running scriptlet: prometheus2-2.22.1-1.el8.x86_64        1/1
  Installing       : prometheus2-2.22.1-1.el8.x86_64        1/1
  Running scriptlet: prometheus2-2.22.1-1.el8.x86_64        1/1
  Verifying        : prometheus2-2.22.1-1.el8.x86_64        1/1

Installed:
  prometheus2-2.22.1-1.el8.x86_64

Complete!
[root@mon ~]#
Enable the prometheus persistently and start the service.
# systemctl enable prometheus.service
# systemctl start prometheus.service
Firewall Exclusion
Allow the firewall for 9090/tcp port number and reload the firewall service.
# firewall-cmd --permanent --add-port=9090/tcp
# firewall-cmd --reload
Accessing Prometheus Dashboard
Right after allowing the port, navigate to anyone of web browser and access the prometheus IP or valid name.
http://monitor.linuxsysadmins.local:9090Once access the prometheus dashboard, Navigate to status –> target
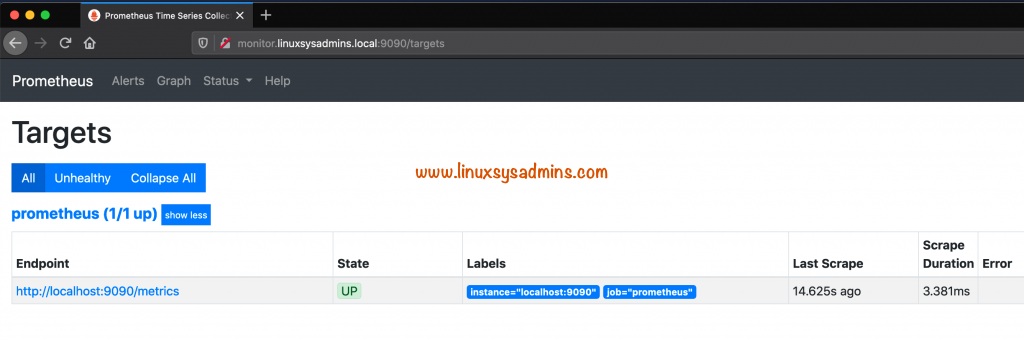
Here we should get the localhost prometheus as a target up and running. Let’s continue the setup with Grafana before moving to client side setup.
Setup Grafana Repository
Create the repo file for grafana.
# vim /etc/yum.repos.d/grafana.repoAppend with the grafana repo information.
[grafana]
name=grafana
baseurl=https://packages.grafana.com/oss/rpm
repo_gpgcheck=1
enabled=1
gpgcheck=1
gpgkey=https://packages.grafana.com/gpg.key
sslverify=1
sslcacert=/etc/pki/tls/certs/ca-bundle.crt
Installing Grafana
Build the yum cache and install the package.
# yum makecache
# yum install grafana -y
Once it installed, enable the service persistently and start the grafana service.
# systemctl enable grafana-server
# systemctl start grafana-server
# systemctl status grafana-server
As we done before same rule with different port (3000) number of grafana.
# firewall-cmd --add-port=3000/tcp --permanent
# firewall-cmd --reload
# firewall-cmd --list-all
Here is the output for reference.
[root@monitor ~]# firewall-cmd --list-all
public (active)
  target: default
  icmp-block-inversion: no
  interfaces: ens18
  sources:
  services: cockpit dhcpv6-client ssh
  ports: 9090/tcp 3000/tcp
  protocols:
  masquerade: no
  forward-ports:
  source-ports:
  icmp-blocks:
  rich rules:

[root@monitor ~]#
Accessing Grafana Dashboard
Fire-up anyone of web browser and navigate to the same URL with port number 3000. The default username and password are “admin“.
Once we login it will prompt to create a new password, use any complex password than the default one.

Adding Data Source
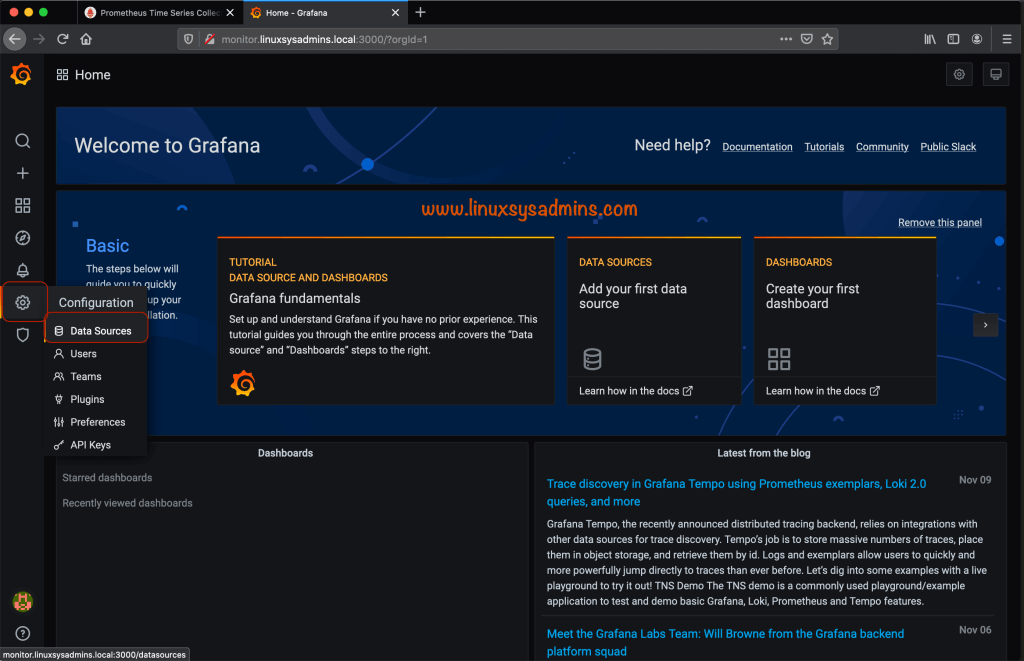
This is how the dashboard will look after a successful login, To show the graph info we need data, so let’s start to import from Prometheus data source.
Click on the gear icon ![]() at the left side bottom and select “Data Sources“
at the left side bottom and select “Data Sources“
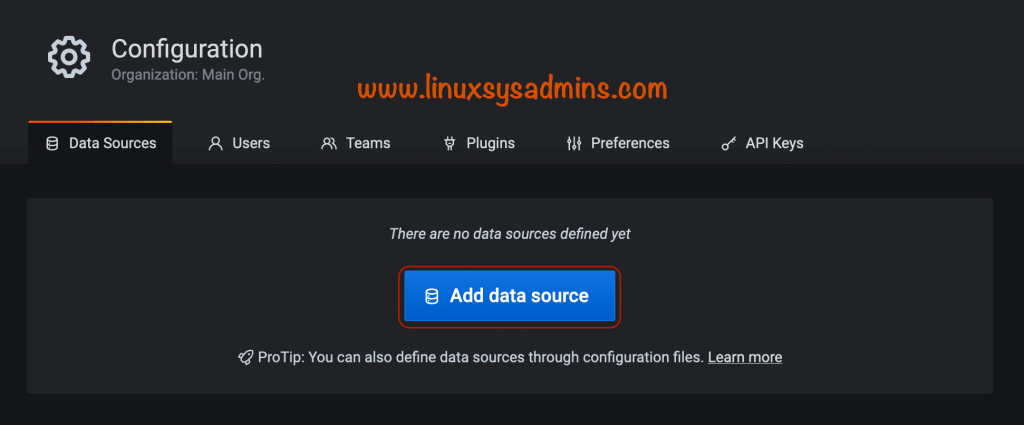
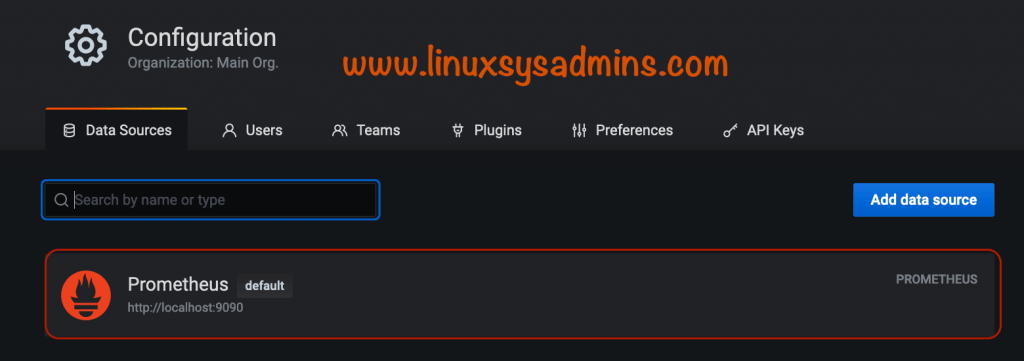
Click Add data source.
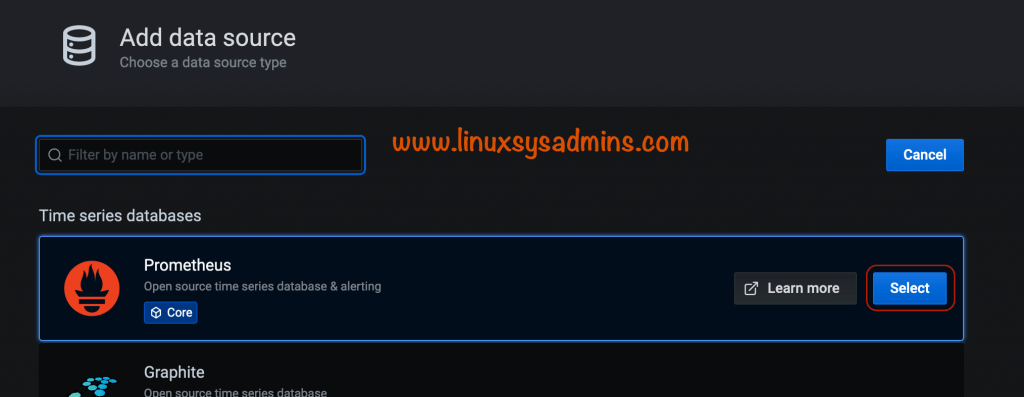
Here we will get different type of data source, at the first we should get the prometheus, Click select.
We have installed Prometheus and Grafana on the same server, Let’s change the URL to localhost.
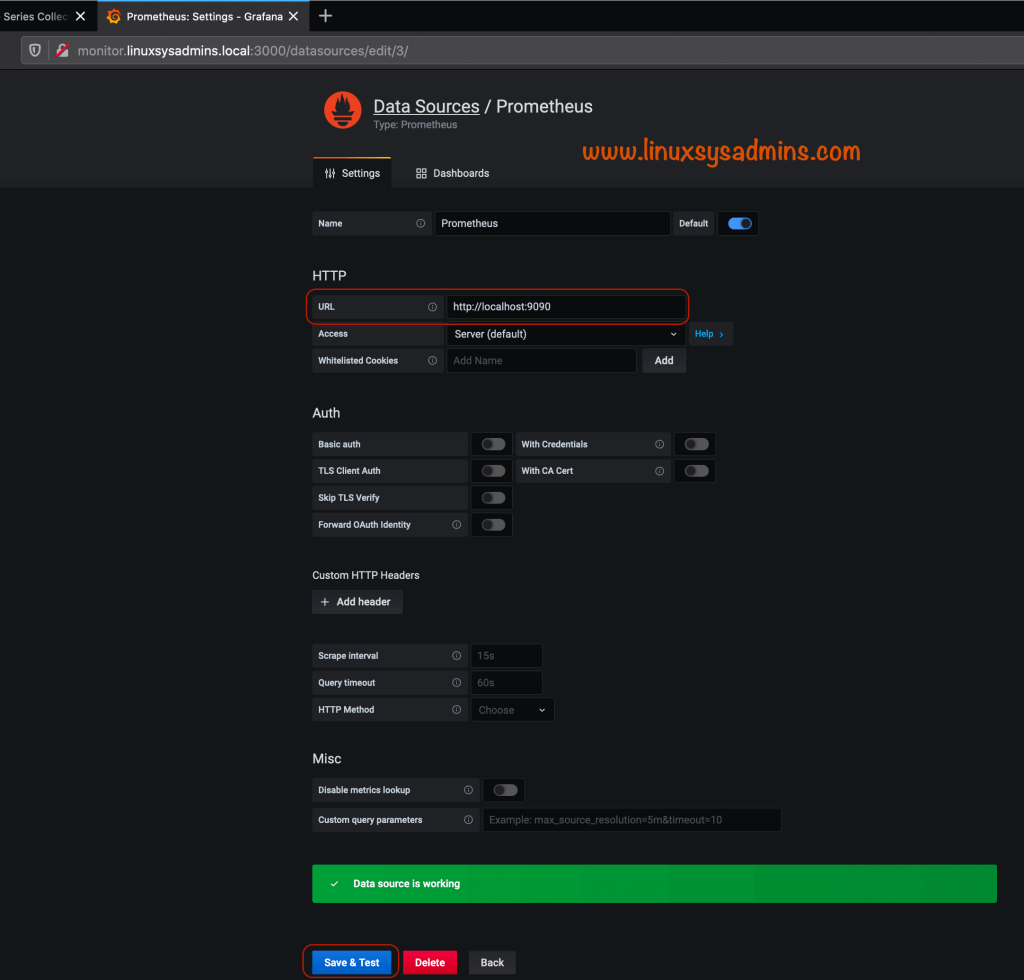
Click save and test, it will save the source as shown below.
Creating Dashboard
We don’t want to put a lot of effort in creating a good looking dashboard with the required information. Instead, let’s import one.
Navigate to + symbol in left side pane and select “Import“
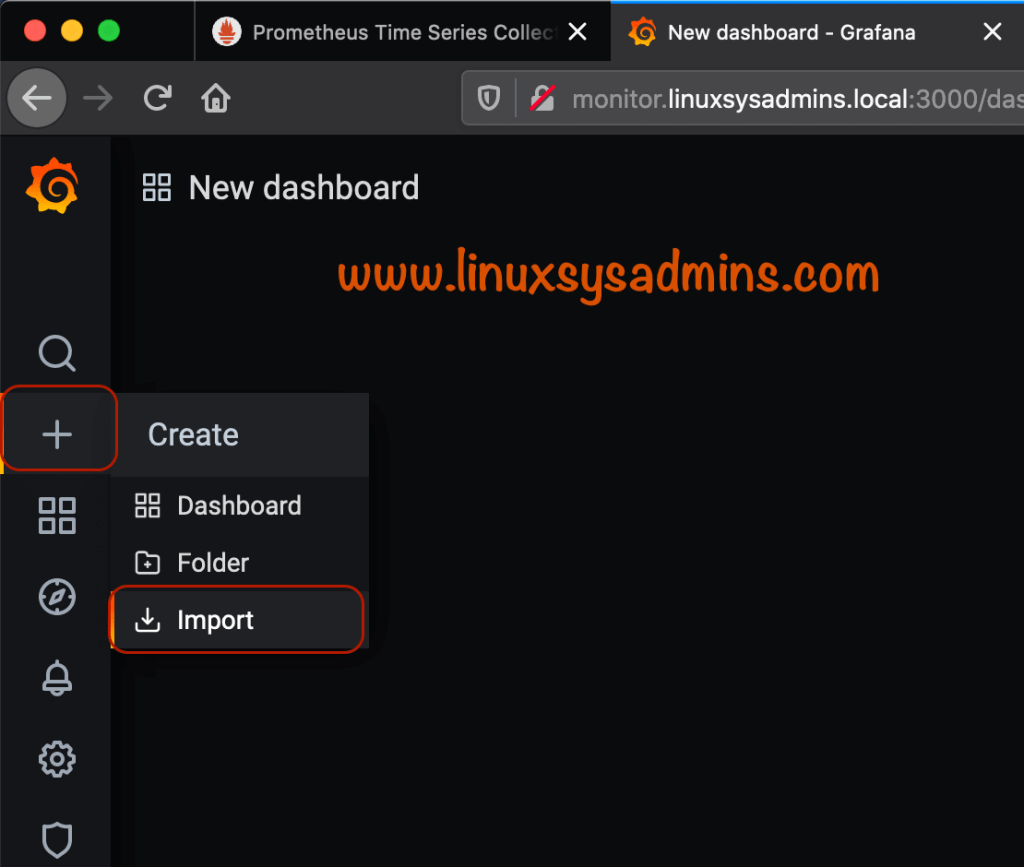
We should get the below window, type the dashboard ID and click Load. This will import a json file from grafana.com
To get the right dashboard look into below URL. The dashboard ID can be copied from right side of each dashboard page.
https://grafana.com/grafana/dashboards+ --> Import --> 1860 --> load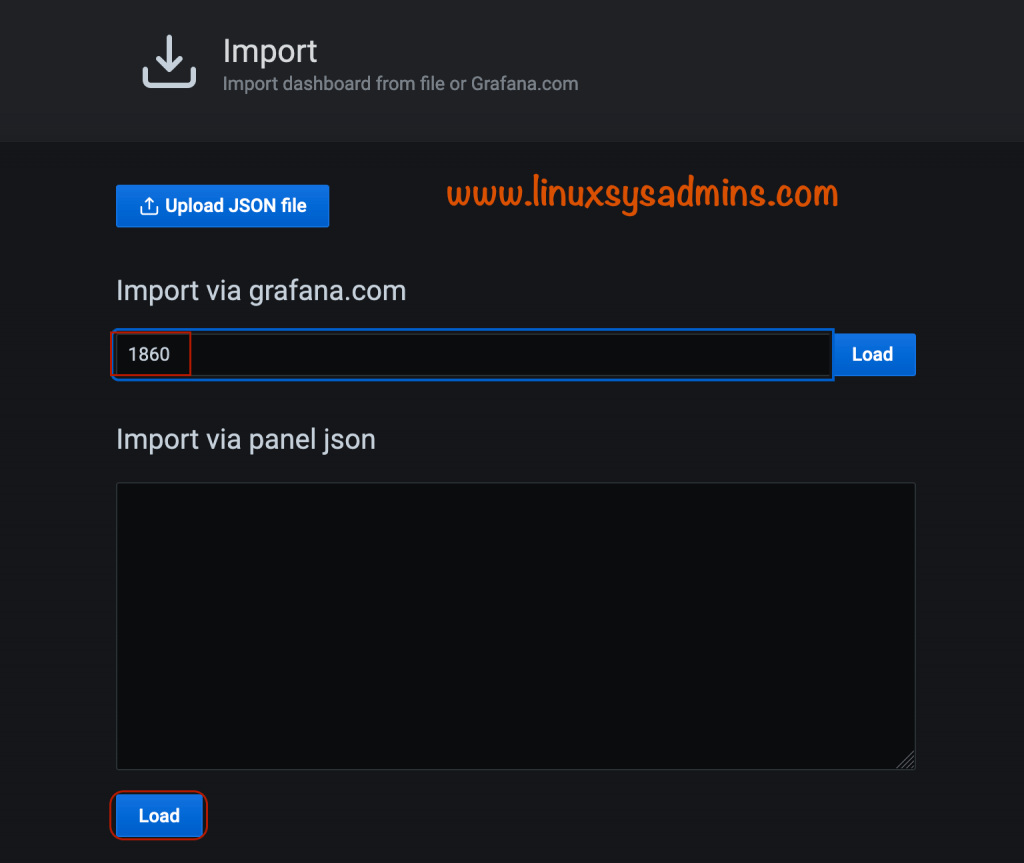
The dashboard ID i’m using one is for node exporter full.
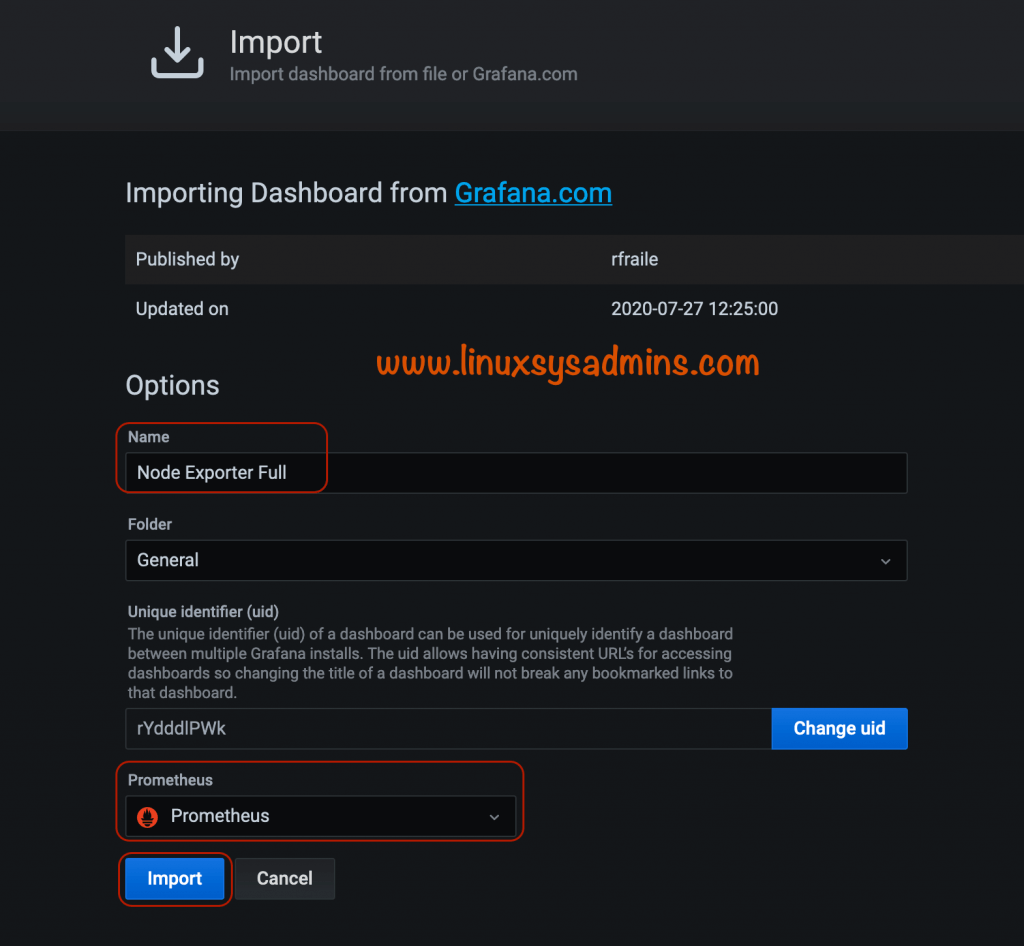
Select Prometheus from drop down list and click Import.
Client-side Configuration
Now, i need to monitor one of Linux server, let’s add it.
Installing Client Packages
First, create the Prometheus repository as we did on the server-side. Then, we need to install Prometheus and node exporter on client-side.
# yum install prometheus2 node_exporter -yOutput for reference
Running transaction
  Preparing        :                                                                1/1
  Running scriptlet: prometheus2-2.22.1-1.el8.x86_64                                1/2
  Installing       : prometheus2-2.22.1-1.el8.x86_64                                1/2
  Running scriptlet: prometheus2-2.22.1-1.el8.x86_64                                1/2
  Running scriptlet: node_exporter-1.0.1-2.el8.x86_64                               2/2
  Installing       : node_exporter-1.0.1-2.el8.x86_64                               2/2
  Running scriptlet: node_exporter-1.0.1-2.el8.x86_64                               2/2
  Verifying        : node_exporter-1.0.1-2.el8.x86_64                               1/2
  Verifying        : prometheus2-2.22.1-1.el8.x86_64                                2/2

Installed:
  node_exporter-1.0.1-2.el8.x86_64     prometheus2-2.22.1-1.el8.x86_64

Complete!
[root@gateway ~]#
Configure Client
Edit the yaml file and add the name of client.
# vi /etc/prometheus/prometheus.ymlOnly we need to give a name and point the prometheus server (192.168.0.50) with port number 9100.
scrape_configs:
  - job_name: 'node_exporter'
    static_configs:
    - targets: ['localhost:9100']

    to

scrape_configs:
  - job_name: 'gateway_server'
    static_configs:
    - targets: ['192.168.0.50:9100']
Enable both Prometheus and Node exporter services persistently, Right after that start the service as well.
# systemctl enable prometheus.service
# systemctl enable node_exporter.service

# systemctl start prometheus.service
# systemctl start node_exporter.service
Firewall for Client Ports
Allow the outbound traffic for 9100/tcp.
# firewall-cmd --add-port=9100/tcp --permanent
# firewall-cmd --reload
# firewall-cmd --list-all
Output after allowing require port.
[root@gateway ~]# firewall-cmd --list-all
public (active)
  target: default
  icmp-block-inversion: no
  interfaces: ens18
  sources:
  services: cockpit dhcpv6-client ftp http mountd nfs nfs3 rpc-bind ssh
  ports: 9100/tcp
  protocols:
  masquerade: no
  forward-ports:
  source-ports:
  icmp-blocks:
  rich rules:

[root@gateway ~]#
Next steps we need to configure on Prometheus server, Switch back to Prometheus Server.
Adding Target (Clients)
Add a target by editing the yaml configuration.
# vim /etc/prometheus/prometheus.yml Just give a name and from which client or target you are getting the datas.
- job_name: 'gateway_server'
static_configs:
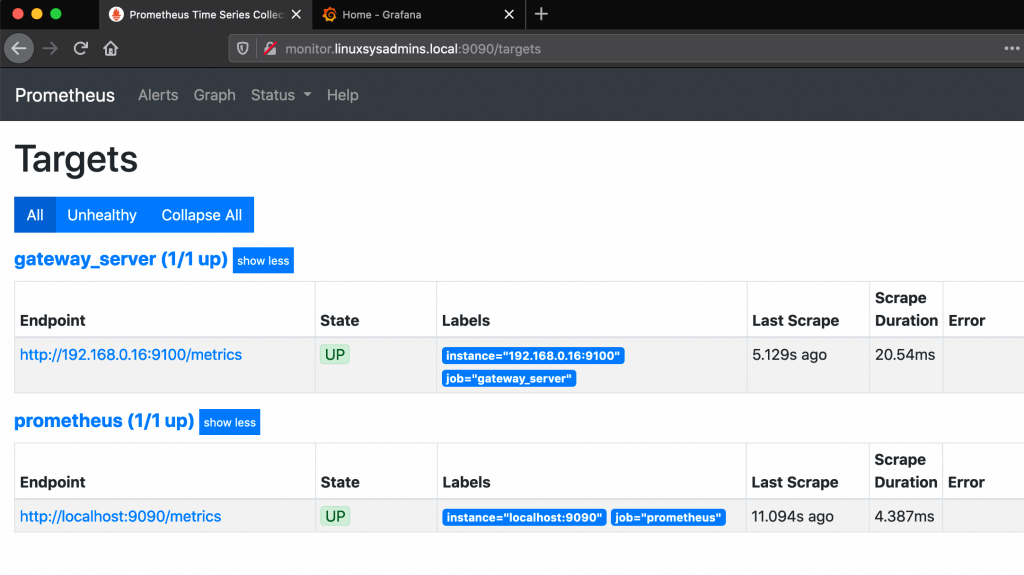
- targets: ['192.168.0.16:9100']
To make the changes effective, restart the Prometheus service.
# systemctl restart prometheus.serviceNow we should get two targets.
Accessing the Dashboard
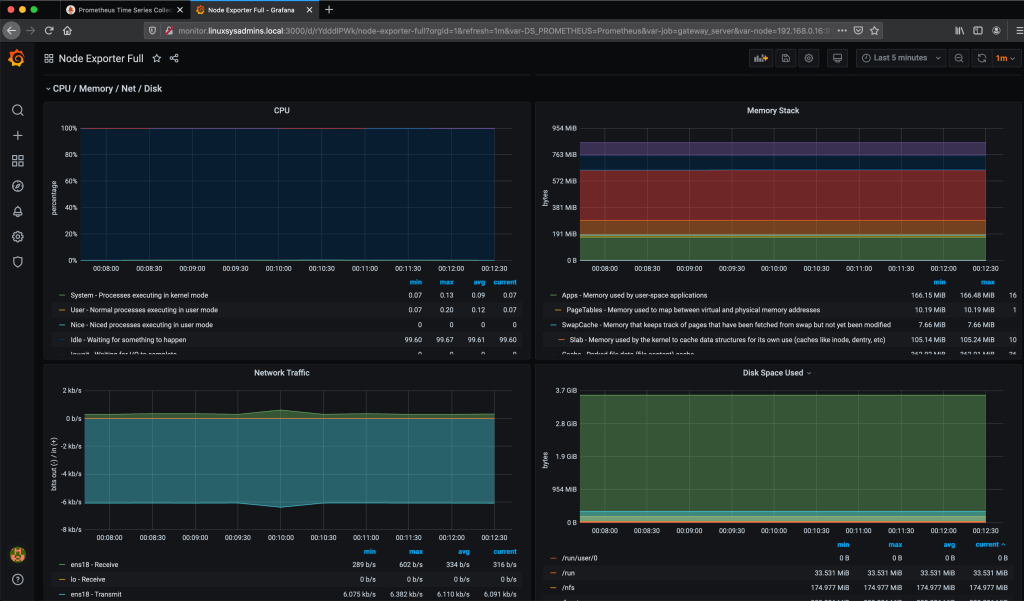
To access the dashboard, Click on “Dashboard” –> again click on “Node Exporter Full“
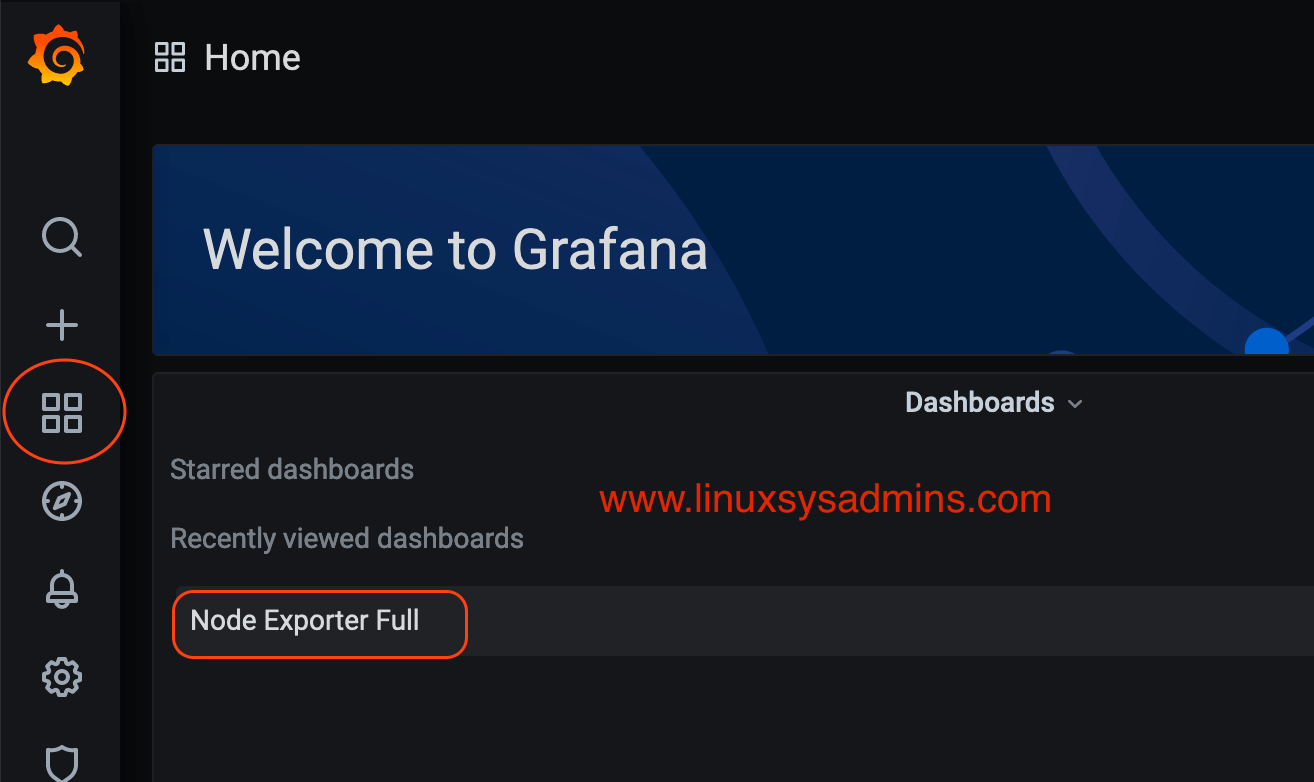
You should get the below dashboard now.
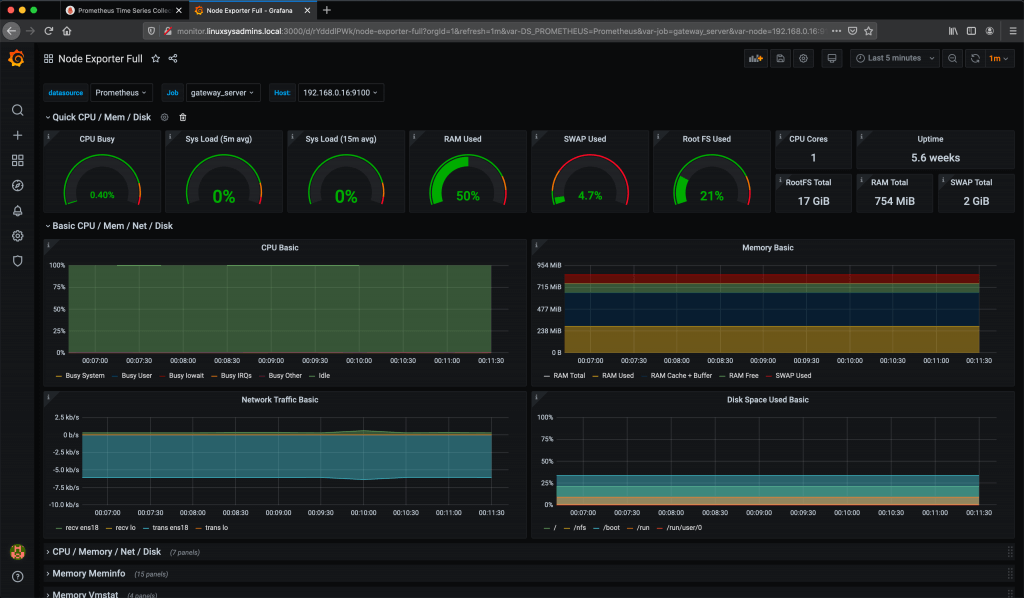
There are hundreds of metric information will be available for a single server, for reference few more attached below.
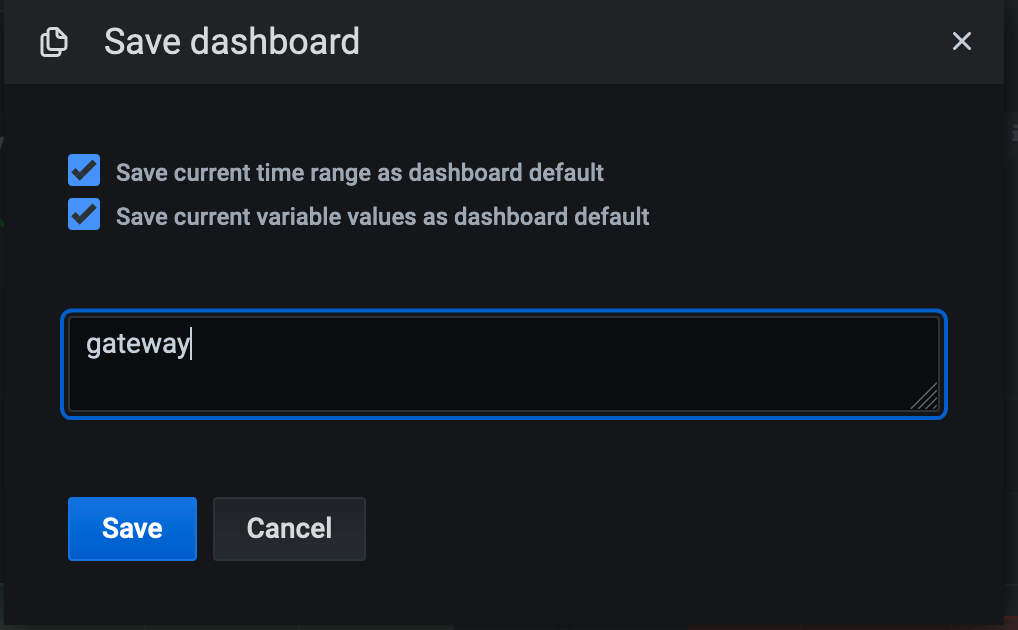
If you need to keep the dashboard for future use, we can save it by clicking on the Save button ![]() in the top right side of the dashboard, Give a name and save it.
in the top right side of the dashboard, Give a name and save it.
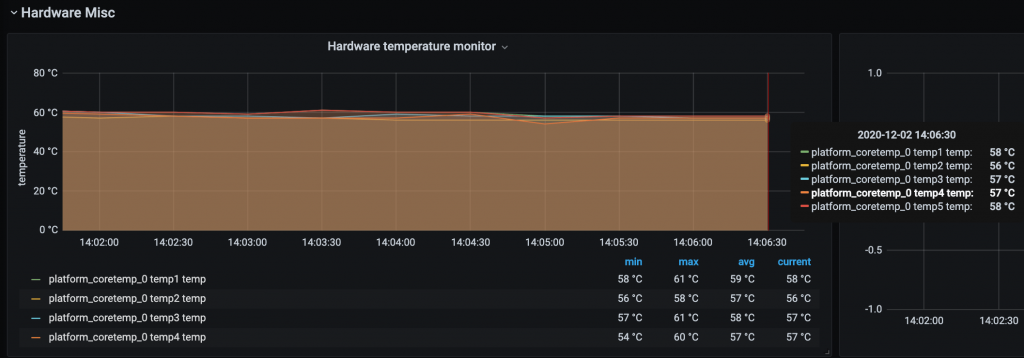
Monitoring Hardware Temperatures
I have 4 numbers of Intel NUC in my home lab, they are screaming because of getting hotter. I need to know what is the current temperature of those NUC. Those tiny machines are running on ProxMox virtualization hosting minimum 8 Virtual machines each.
If we could have used InfluxDB then this could help to monitor those temperature.
Proxmox VE Sensors
https://grafana.com/grafana/dashboards/12913Let’s stick with our Prometheus with node exporter.
Download and install the script to enable the required Repository for Prometheus.
# curl -s https://packagecloud.io/install/repositories/prometheus-rpm/release/script.deb.sh | sudo bashInstall the package.
# apt-get install prometheus prometheus-node-exporter Make the required changes for in /etc/prometheus/prometheus.yml
  - job_name: pve1
    # If prometheus-node-exporter is installed, grab stats about the local
    # machine by default.
    static_configs:
      - targets: ['192.168.0.50:9100']
Restart the services.
# systemctl restart prometheus.service
# systemctl restart prometheus-node-exporter.service
# systemctl status prometheus.service
# systemctl status prometheus-node-exporter.service
Once again, Back to Server side and add the client config under vi /etc/prometheus/prometheus.yml
  - job_name: 'pve1'

    static_configs:
    - targets: ['192.168.0.11:9100']
Restart the prometheus service.
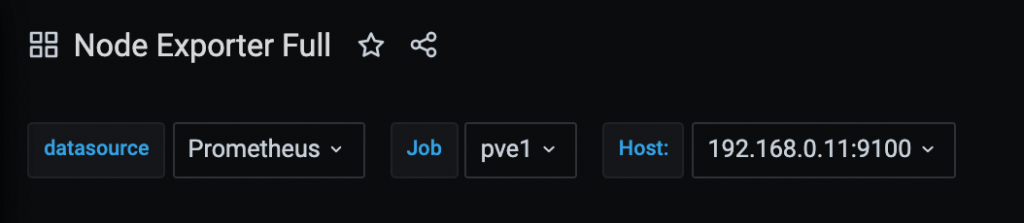
# systemctl start prometheus.serviceCheck from Dashboard to left corner and select the PVE1 from drop down list.
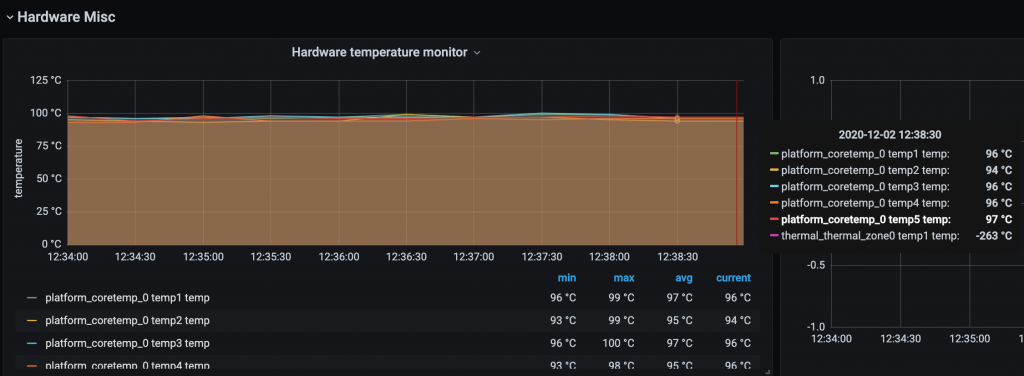
Kept a USB fan Next to NUC in full speed for one and half hour and this is the result. To conclude, Prometheus with Grafana show as something related to temperature as well.
That’s it, we have completed with monitoring a Linux server using Prometheus with Grafana.
Conclusion:
Prometheus with Grafana monitoring will fire-up very cool dashboards by looking into each resource usage of Linux servers. Will come up with new guide related to Prometheus with Grafana, subscribe to newsletter and stay tuned.
Hello Babin Lonston,
Your tutorial is very helpful to me to Install the prometheus and nodeexporter on the server. Can you please make one more tutorial for alert manager to install and configure with Prometheus and share it with me
How to add multiple host/vm in prometheus and grafana?
Before this i setup and try to add more than 1 vm and host but not working..so any idea to add more host/vm??
Install the prometheus and nodeexporter package on client, configure the yaml and restart the prometheus service, then back to server side and configure the yaml file with new target then reload the prometheus. Login to grafana and select the client from top left side corner drop down list.