Table of Contents
Introduction
In today’s guide let us install and access Kubernetes dashboard. By performing a few steps on our existing Kubernetes cluster the dashboard of Kubernetes will be up and running.
The initial requirement for bringing up a dashboard will be up and running with an existing k8s and certificate files for the dashboard. Let’s start to create the certificate files first using OpenSSL command.
Generate the Certificate
Prior to any settings, we require to create a signing request, certificate and key. This is the main part for setting up to access Kubernetes dashboard.
# mkdir /root/certs
# cd ~/certs
# openssl genrsa -out k8s_dashboard.key 2048
# openssl rsa -in k8s_dashboard.key -out k8s_dashboard.key
# openssl req -sha256 -new -key k8s_dashboard.key -out k8s_dashboard.csr
# openssl x509 -req -sha256 -days 365 -in k8s_dashboard.csr -signkey k8s_dashboard.key -out k8s_dashboard.crt
Once the certificate is ready we need to load it into kubernetes secret.
Load Certificate into Secret
Use kubectl command to create and load the Certificate into the secret.
Before that we need to have the namespace for dashboard.
# kubectl create namespace kubernetes-dashboardRight after creating the namespace, load the certificate.
root@k8mas1:~# kubectl -n kubernetes-dashboard create secret generic kubernetes-dashboard-certs --from-file=/root/certs/
secret/kubernetes-dashboard-certs created
root@k8mas1:~#

# kubectl get secrets --namespace=kubernetes-dashboard
List the secrets created for kuberenetes-dashboard namespace.
Deploy the Dasboard
To start with deploying the dashboard container, Run kubectl command which prepared with the k8s-dashboard service account, role, role binding, deployment and service for Kubernetes dashboard.
Download the dashboard yam file from git using wget.
# wget https://raw.githubusercontent.com/kubernetes/dashboard/v2.0.0/aio/deploy/recommended.yamlOnce downloaded create the dashboard by running below command.
# kubectl apply -f recommended.yamlOutput for reference, Once we run the above yaml file it will create with all required namespace, service account, service, secrets etc.
root@k8mas1:~/certs# kubectl apply -f recommended.yaml
namespace/kubernetes-dashboard created
serviceaccount/kubernetes-dashboard created
service/kubernetes-dashboard created
secret/kubernetes-dashboard-certs created
secret/kubernetes-dashboard-csrf created
secret/kubernetes-dashboard-key-holder created
configmap/kubernetes-dashboard-settings created
role.rbac.authorization.k8s.io/kubernetes-dashboard created
clusterrole.rbac.authorization.k8s.io/kubernetes-dashboard created
rolebinding.rbac.authorization.k8s.io/kubernetes-dashboard created
clusterrolebinding.rbac.authorization.k8s.io/kubernetes-dashboard created
deployment.apps/kubernetes-dashboard created
service/dashboard-metrics-scraper created
deployment.apps/dashboard-metrics-scraper created
root@k8mas1:~/certs#
List the created Resources
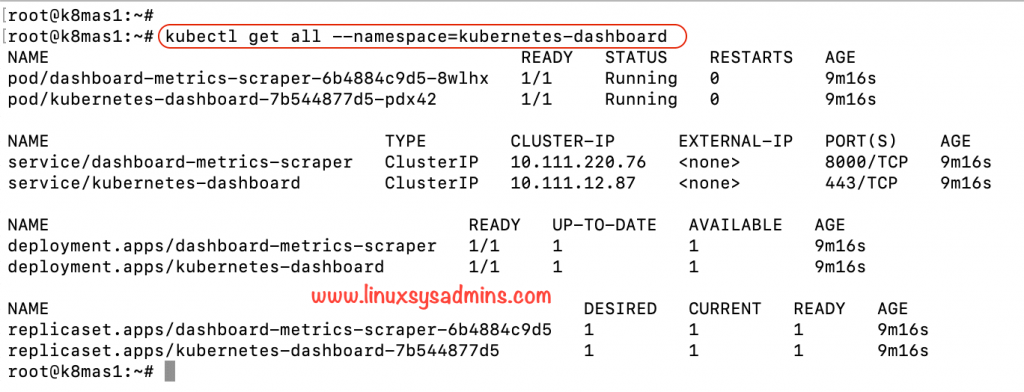
List the created resources of kubernetes-dashboard.
# kubectl get all --namespace=kubernetes-dashboardTo access Kubernetes dashboard it required to have all above pods, services, deployment and replica-set.
Expose the Dashboard
Expose dashboard service on a NodePort, Once the dashboard is deployed we are not yet done with it. Now we need to make sure to expose the network so that the dashboard can be accessed from any web browser.
The type with ClusterIP will have an internal communication.
root@k8mas1:~# kubectl get service --namespace=kubernetes-dashboard
NAME                      TYPE       CLUSTER-IP    EXTERNAL-IP PORT(S)       AGE
dashboard-metrics-scraper ClusterIP  10.104.228.89             8000/TCP      18m
kubernetes-dashboard      ClusterIP  10.103.220.191            443/TCP       18m
root@k8mas1:~#
Edit the kubernetes-dasboard and replace the ClusterIP to NodePort so that your dashboard will be expose to access from outside.
# kubectl edit services --namespace=kubernetes-dashboard kubernetes-dashboardtype: ClusterIP
to
type: NodePortNow once again get the service, we can notice the type changed from ClusterIP to NodePort.
root@k8mas1:~# kubectl get service --namespace=kubernetes-dashboard
NAME                      TYPE      CLUSTER-IP    EXTERNAL-IP PORT(S)       AGE
dashboard-metrics-scraper ClusterIP 10.104.228.89             8000/TCP      19m
kubernetes-dashboard      NodePort  10.103.220.191            443:31963/TCP 19m
root@k8mas1:~#
Keep a note on the port number from the above output. To access Kubernetes dashboard the port 31963 will be used in this guide. In your setup, it may be in the range of 30000 – 32767.
Creating Service Account with Role Binding
Create a service account & cluster role, assign the service account with required roles.
apiVersion: v1
kind: ServiceAccount
metadata:
  name: linuxsysadmins
  namespace: kube-system
---
apiVersion: rbac.authorization.k8s.io/v1
kind: ClusterRoleBinding
metadata:
  name: linuxsysadmins
roleRef:
  apiGroup: rbac.authorization.k8s.io
  kind: ClusterRole
  name: cluster-admin
subjects:
- kind: ServiceAccount
  name: linuxsysadmins
  namespace: kube-system
Copy the above YAML code and create a file without making Syntax errors.
# kubectl apply -f dashboard.ymlCreate Token for Kubernetes Dashboard
Here we are getting the token which we created in our previous steps. This will be use for accessing our dashboard from any web browser.
# token=$(kubectl -n kube-system get secret | grep linuxsysadmins | awk '{print $1}')
# kubectl -n kube-system describe secret $token |grep token: |awk '{print $2}'
Above command will grab the token to login the web UI.
Access Kubernetes Dashboard
Navigate to the URL by pointing you IP/Domain name with the port number we got from kubectl get service --namespace=kubernetes-dashboard output.
Click on Advanced.
Accept the Risk and Continue to access the web UI.
Enter the copied token and click sign in.
Once we successfully login the dashboard we will be taken to Overview.
To know the list of nodes click on Nodes in the left hand side.
To list created pods in a namespace, click on left side Pods menu.
At the almost bottom we can see the about menu to view the current version of dashboard we are using.
That’s it, we have successfully completed with setting up and access kubernetes dashboard.
Conclusion
To access Kubernetes dashboard we need to follow few steps to deploy them. To have a graphical view on our existing Kubernetes cluster this will be helpful. Subscribe to our newsletter for more articles related to Kubernetes.

Awesome
Thanks once again for this guide, spent too many hours last night getting frustrated with all this.
Woke up this morning, found your guide and boom…. 15mins later sorted.
Thanks once again
Thanks! Finally a guide that works.
Things move so fast in the kubernetes world that information is soon outdated.